


Part 1: Insight into Your Photovoltaic System
Make more money with your photovoltaic system, start with IAMMETER.
Maximize Your Profits from Photovoltaic Systems with IAMMETER—monitoring is simply a means, making money is the goal.
Introduction
Our previous documents were too focused on the technology itself, so we plan to create a down-to-earth document that directly shows customers how to profit more with IAMMETER.
This series of articles will mainly include the following topics:
- Deep insights into the operational status of photovoltaic systems.
- Dynamically adjust the load based on grid power to maximize the local consumption of all electricity output by the inverter, minimizing the amount exported to the grid ("Exported Energy").
- Evaluating battery storage systems
This article is the first in the series, "Deep Insights into the Operational Status of Photovoltaic Systems"
Understanding Key Parameters of Photovoltaic Systems
As photovoltaic inverters become more widespread, the revenue per kWh fed into the grid is decreasing. The gap between the revenue per kWh from feed-in and the cost per kWh of electricity consumption is widening.
In scenarios where the feed-in tariff is much lower than the electricity price, the higher the self-consumption rate of the photovoltaic system,the greater the customer's benefit.
There are mainly two methods to optimize the self-consumption rate of a photovoltaic system:
- Dynamically control loads based on grid power.
- Introduce a storage system.
No matter which optimization method is used, it actually targets the following three parameters:
- "Yield": The total electricity generated by the inverter (kWh).
- "Exported energy": The portion of the inverter's generated electricity that is fed into the grid (kWh).
- "Direct self-use energy": The portion of the inverter's generated electricity that is used directly on-site (kWh).
The larger the "Exported Energy," the greater the potential for optimization.
This article, as the first in the series, mainly discusses how to obtain and understand these parameters through the IAMMETER system.
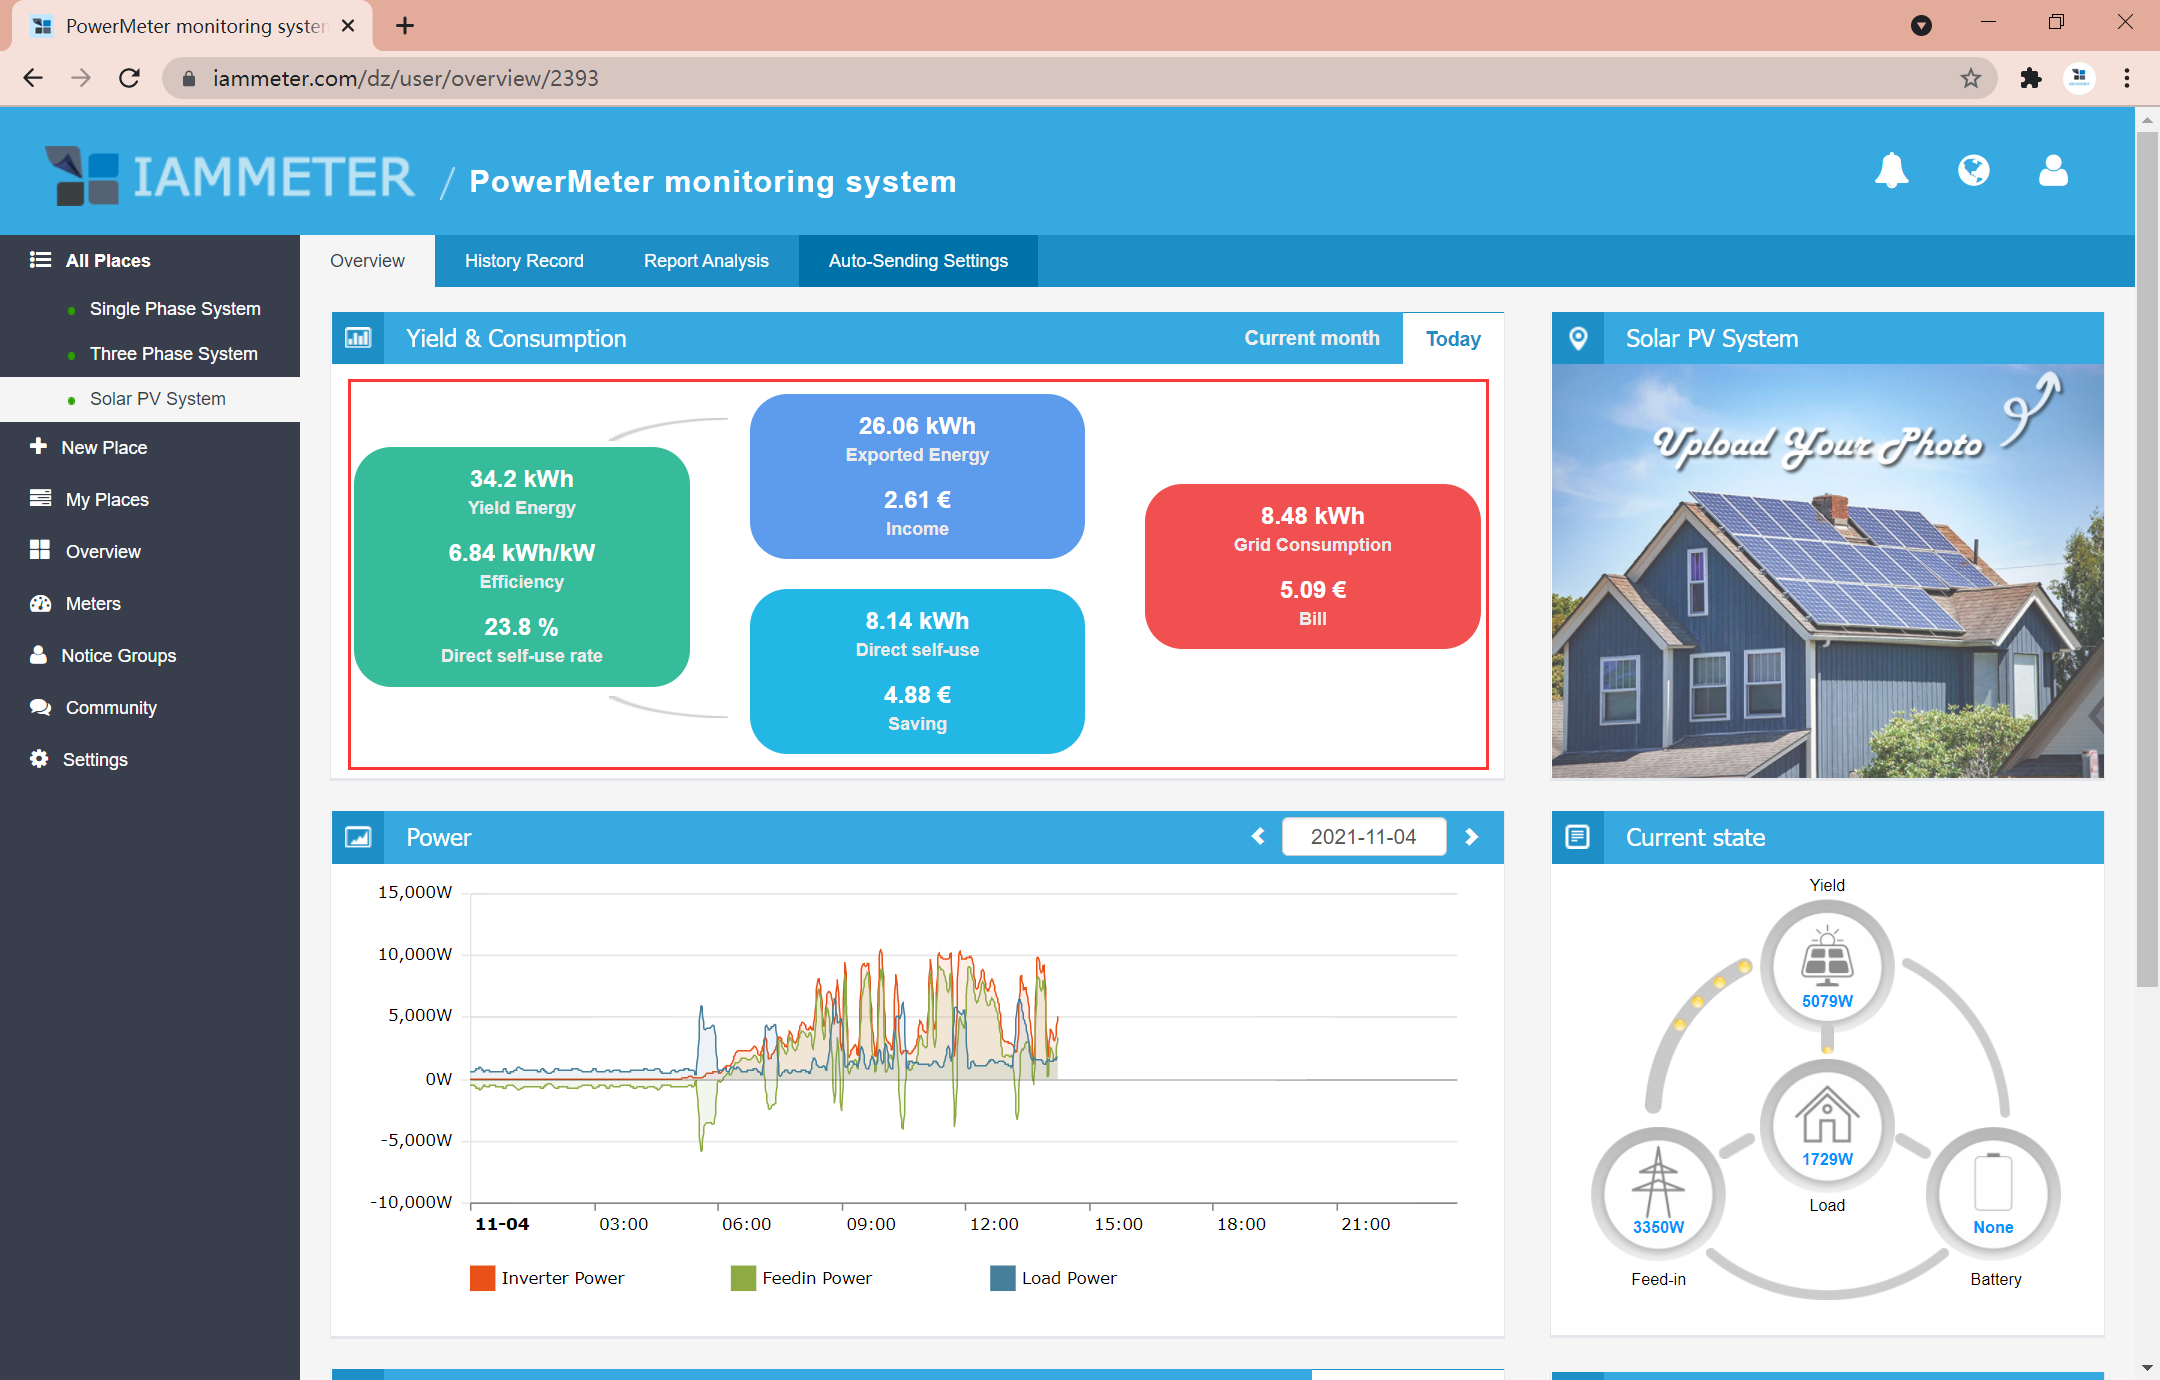
"Yield Energy"
"Yield Energy" is the inverter output data measured directly by the meter installed at the inverter output.
"Yield Energy" = "Exported Energy" + "Direct self-use"
Visible Data Output
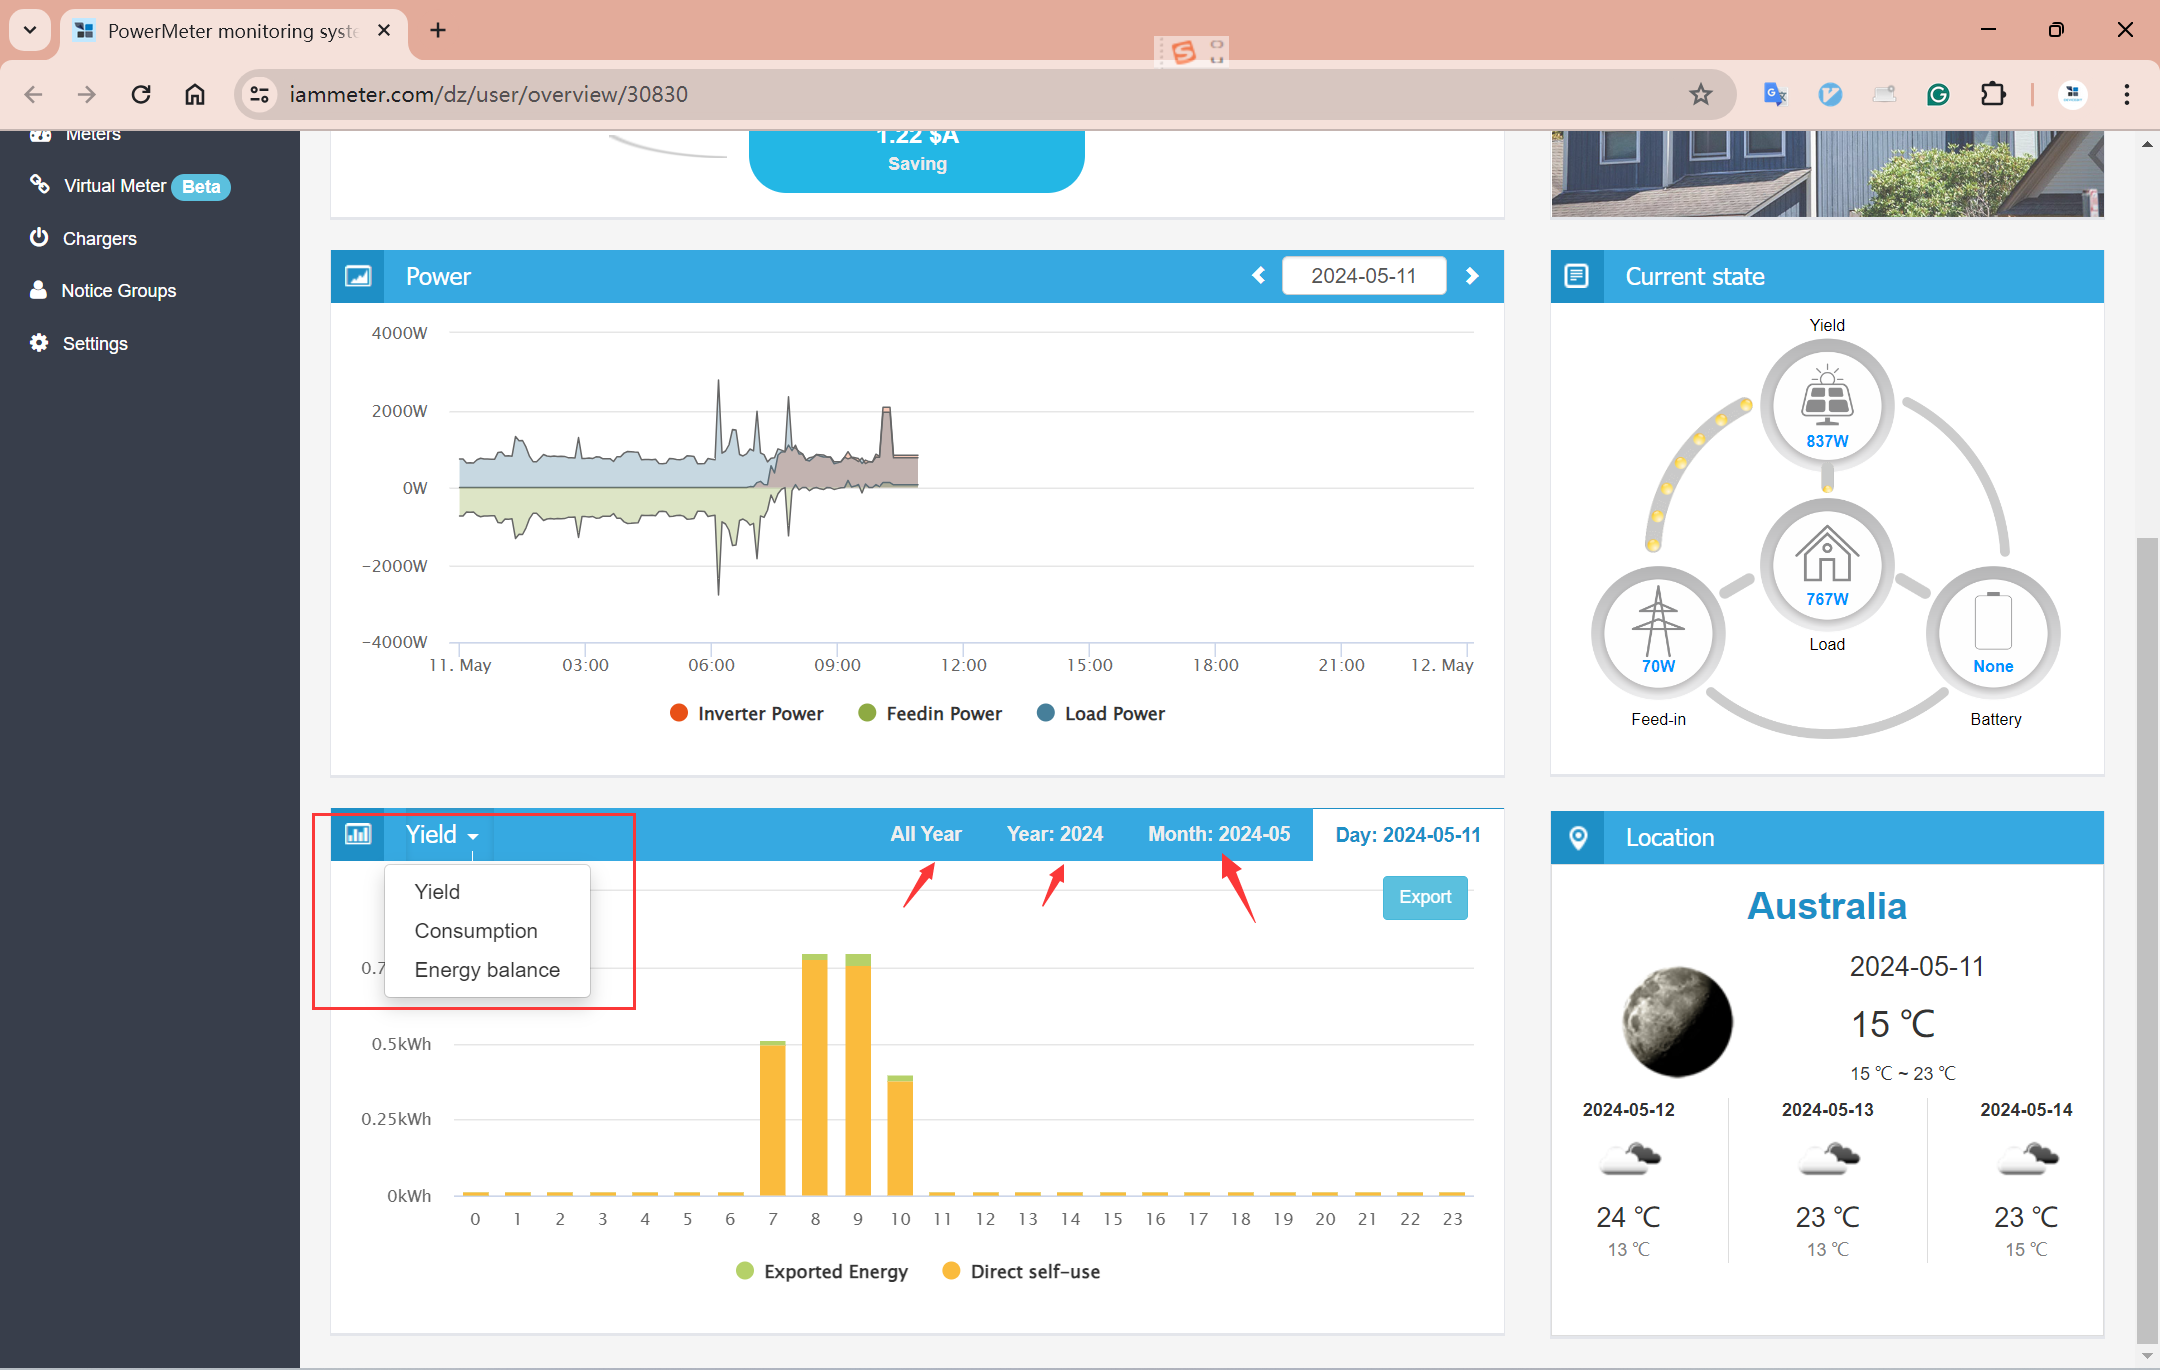
With this "Yield" data, you can see the inverter's electricity production every hour, day, month, and year, and also intuitively grasp the proportion of "Exported Energy" and "Direct Self-Use" within each time period.
- Check if the electricity generation is normal within the period. If you notice a reduction in output on any particular day, you can further investigate to determine the specific hour the issue occurred.
- Examine the proportion of "Exported Energy" and "Direct Self-Use" during each time interval.
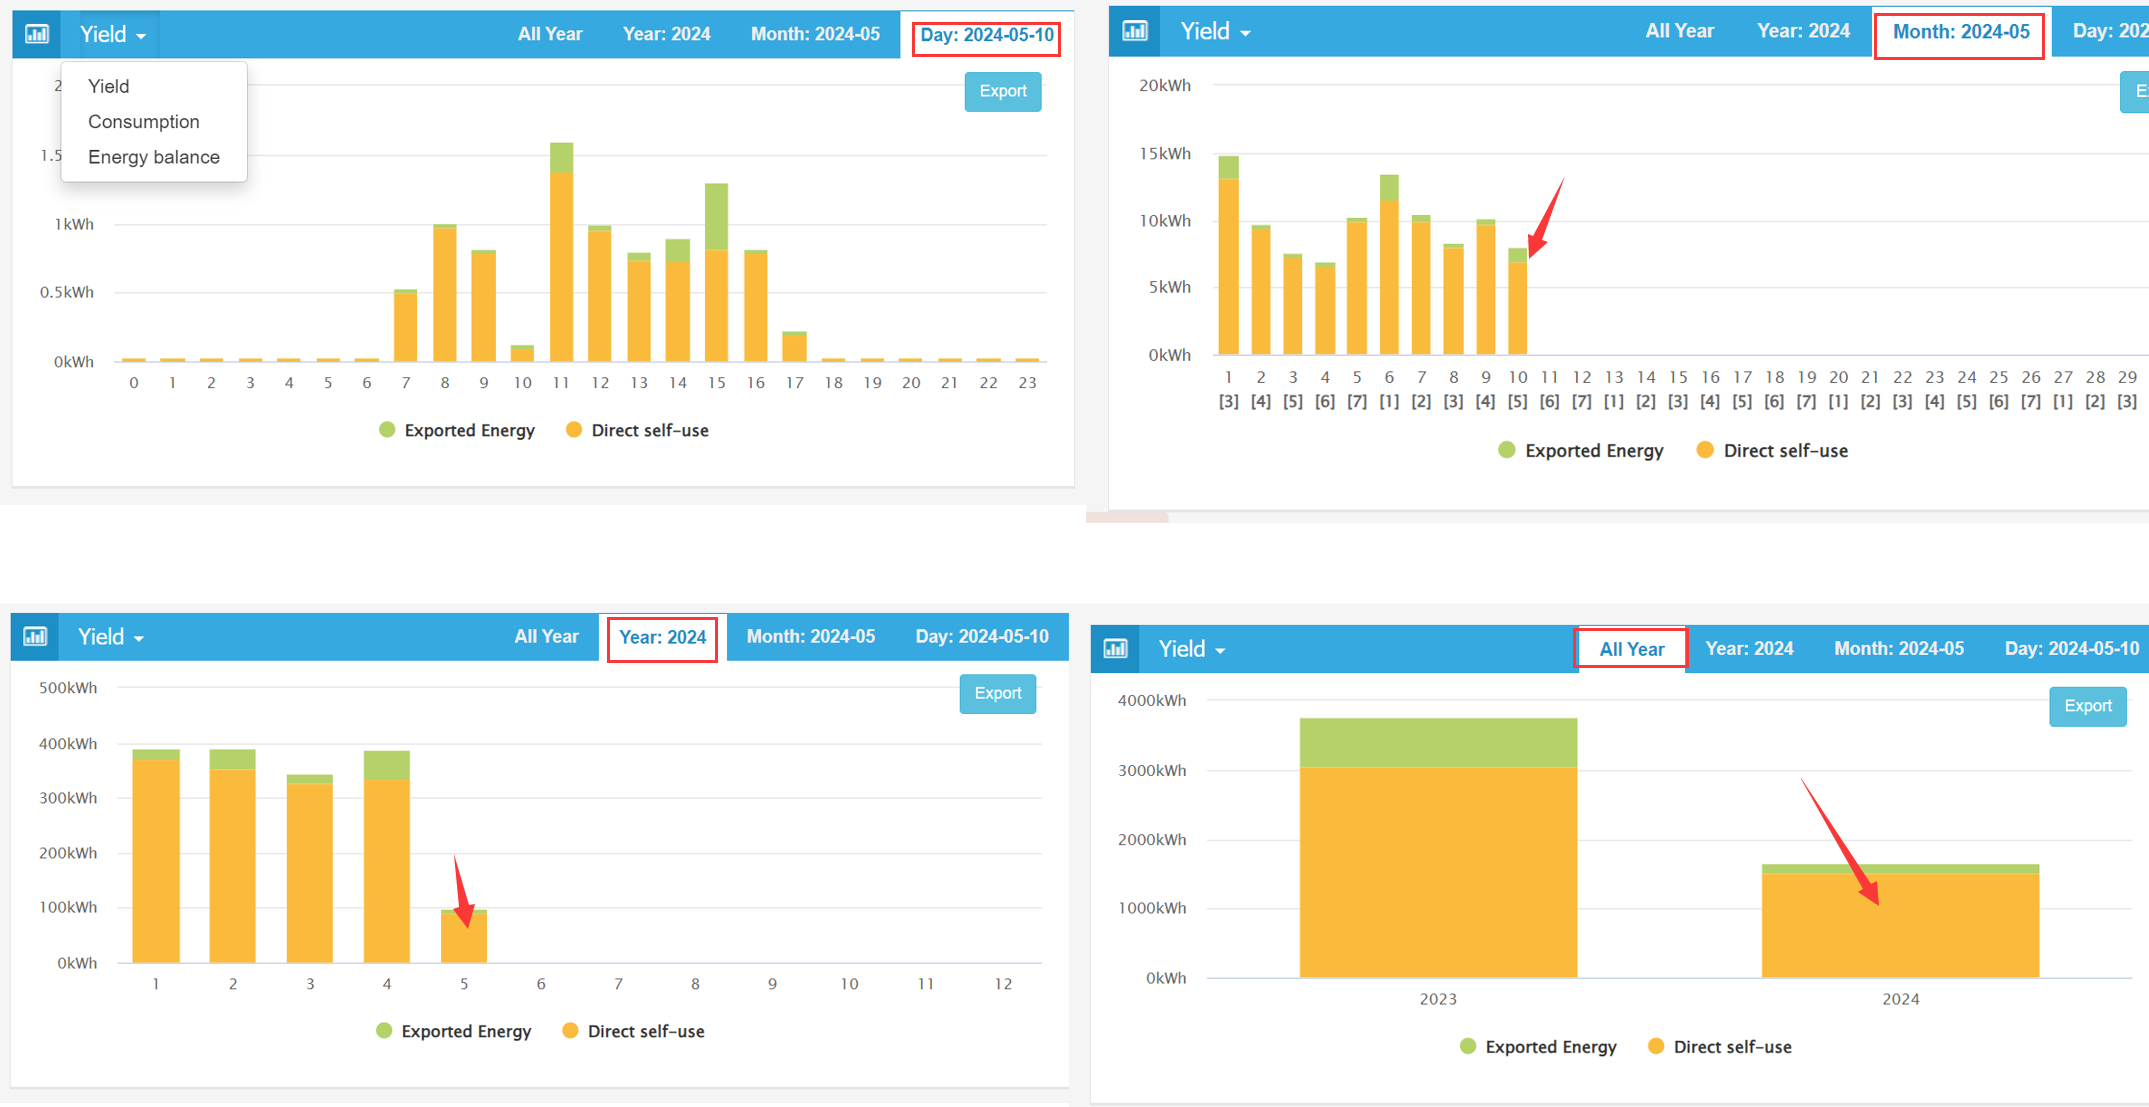
You can click tabs to switch observation time periods, observing hourly, daily, monthly, and yearly data. You can also directly click on a bar in the chart to drill down to the next level.
For example, clicking on May in the Monthly chart will take you to the Daily chart for May, and clicking on May 10th in the Daily chart will take you to the Hourly chart for May 10th.
Data Insights
From the following image, you can clearly see a significant difference in the self-use rates between two sites.
- Site A feeds the majority of its generated electricity into the grid, with very little self-use.
- Site B (noticeably with a battery storage system introduced) has a much higher self-use rate than Site A.
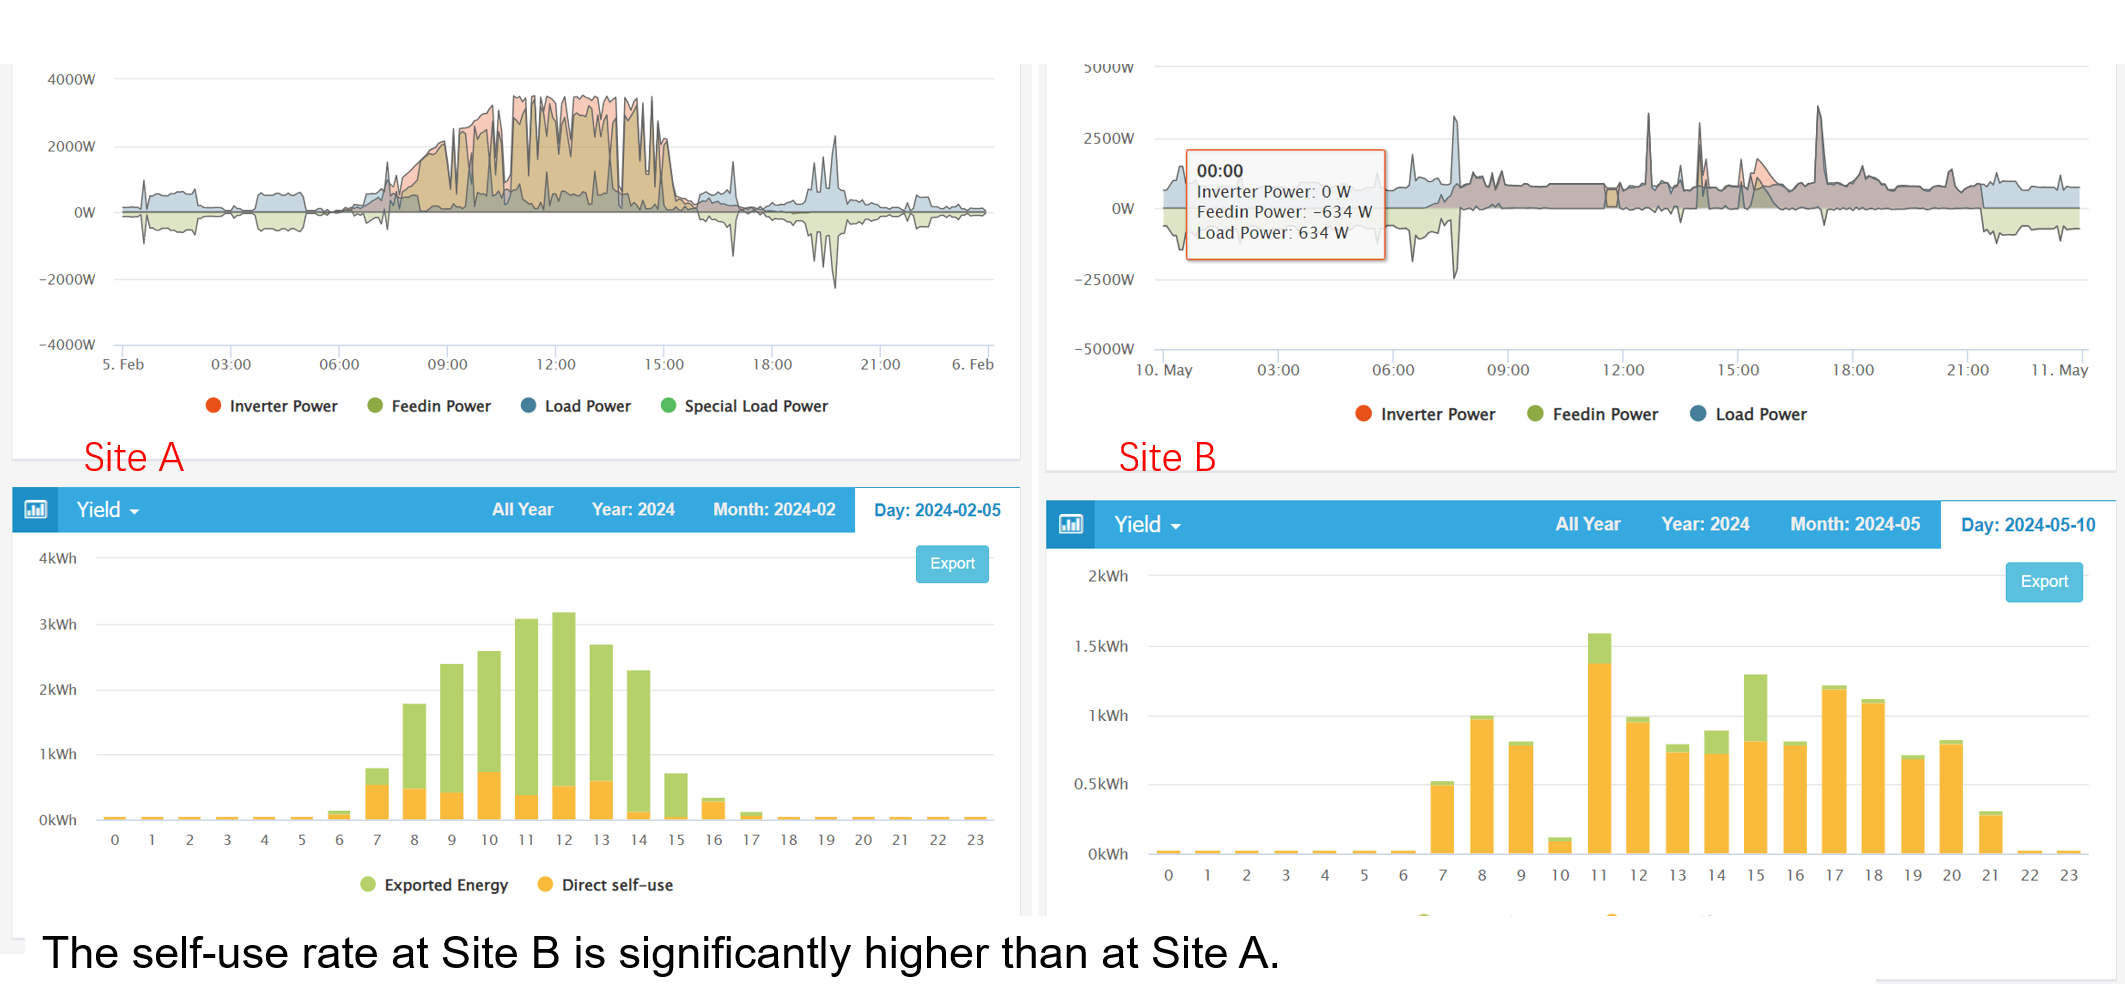
If your site monitoring data, like at Site A, shows that a large portion of the generated electricity is being fed into the grid each day, and the feed-in tariff is much lower than the cost of electricity usage, then you should consider further optimizing your photovoltaic system, trying to use up the grid-fed electricity locally with your loads, or consider introducing a battery storage system.
This document primarily focuses on how to comprehensively understand the parameters of your photovoltaic system. Specific optimization strategies based on these parameters will be discussed in subsequent documents.
"Consumption"
"Consumption" refers to the actual energy consumption value calculated by the system.
It includes energy directly consumed from the grid ("Grid Consumption") and energy provided by the inverter ("Direct Self-Use").
"Consumption" = "Grid Consumption" + "Direct self-use"
Visible Data Output
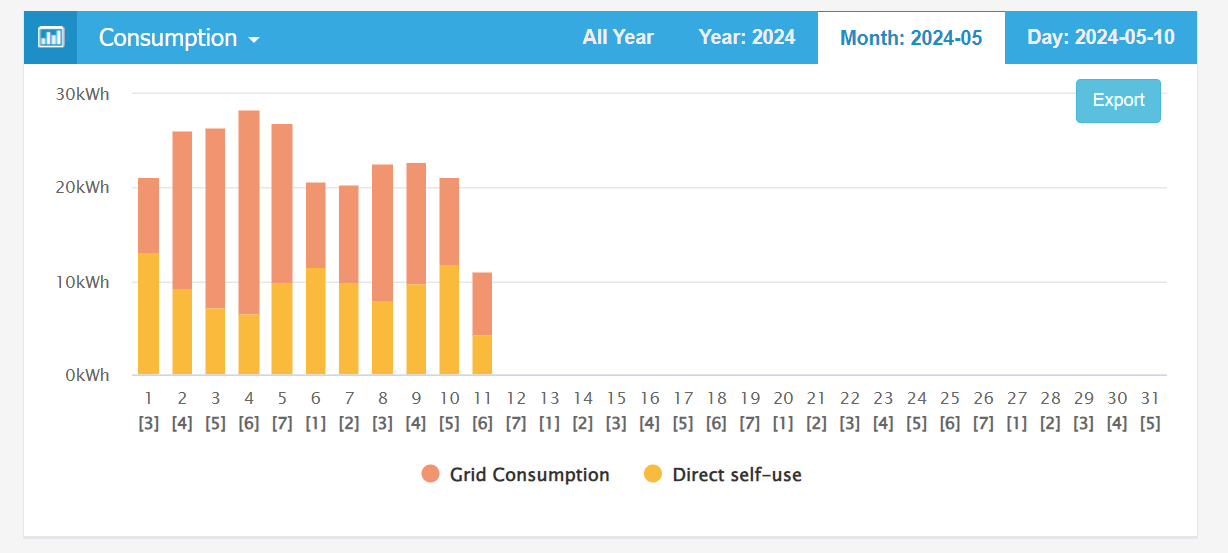
With this "Consumption" data, you can see the energy consumption every hour, day, month, and year, and also observe the proportion of "Grid Consumption" and "Direct self-use" within each time period.
- Observe daily data to check for any unusual energy consumption. If found, you can click further on the bar to observe hourly data.
- The proportion of "Grid Consumption" and "Direct self-use" in each time range.
Daily consumption Kwh chart
Data Insights
Statistics show that if you start paying attention to energy consumption, you can save at least 10-30% on electricity.
The "consumption" chart can help you analyze energy consumption , such as:
- Turning off unnecessary loads (if you find high energy consumption in a home without people or an office during holidays).
- Adjusting the operating times of some loads (e.g., shifting the heating of the boiler tank from on-peak to off-peak periods).
These measures can help you save a significant amount of money.
Additionally, we can analyze many potential details from the "consumption" chart as shown below.
Hourly consumption Kwh chart
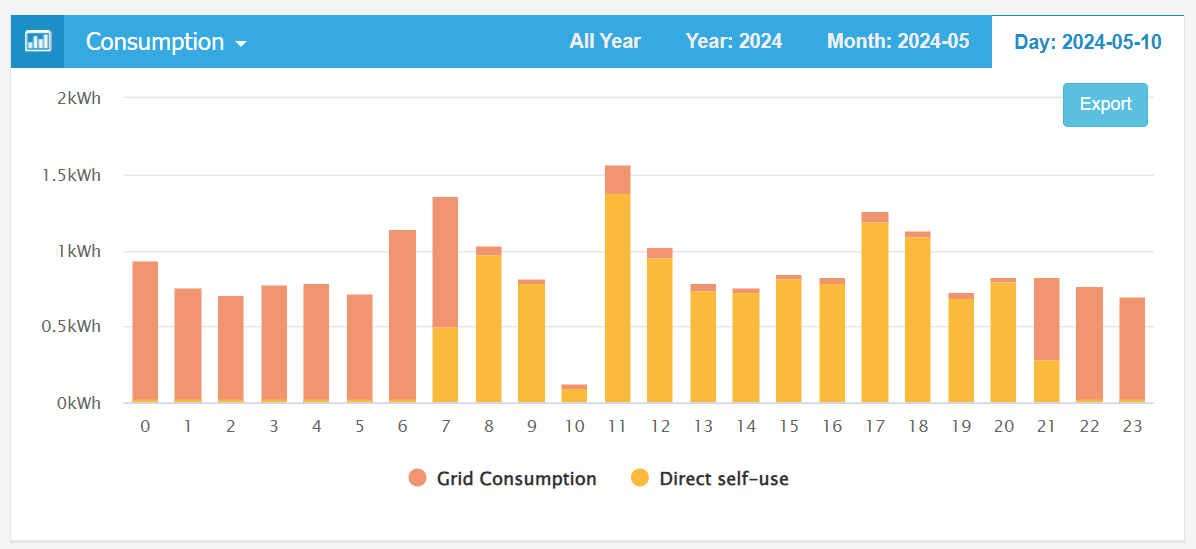 The screenshot shows that from 8 AM to 8 PM, the "Direct Self-Use" portion essentially covers all of the system's consumption, leading to the following conclusions:
- The system definitely includes a battery storage component.
- The battery storage system is operating in "maximum self-consumption" mode.
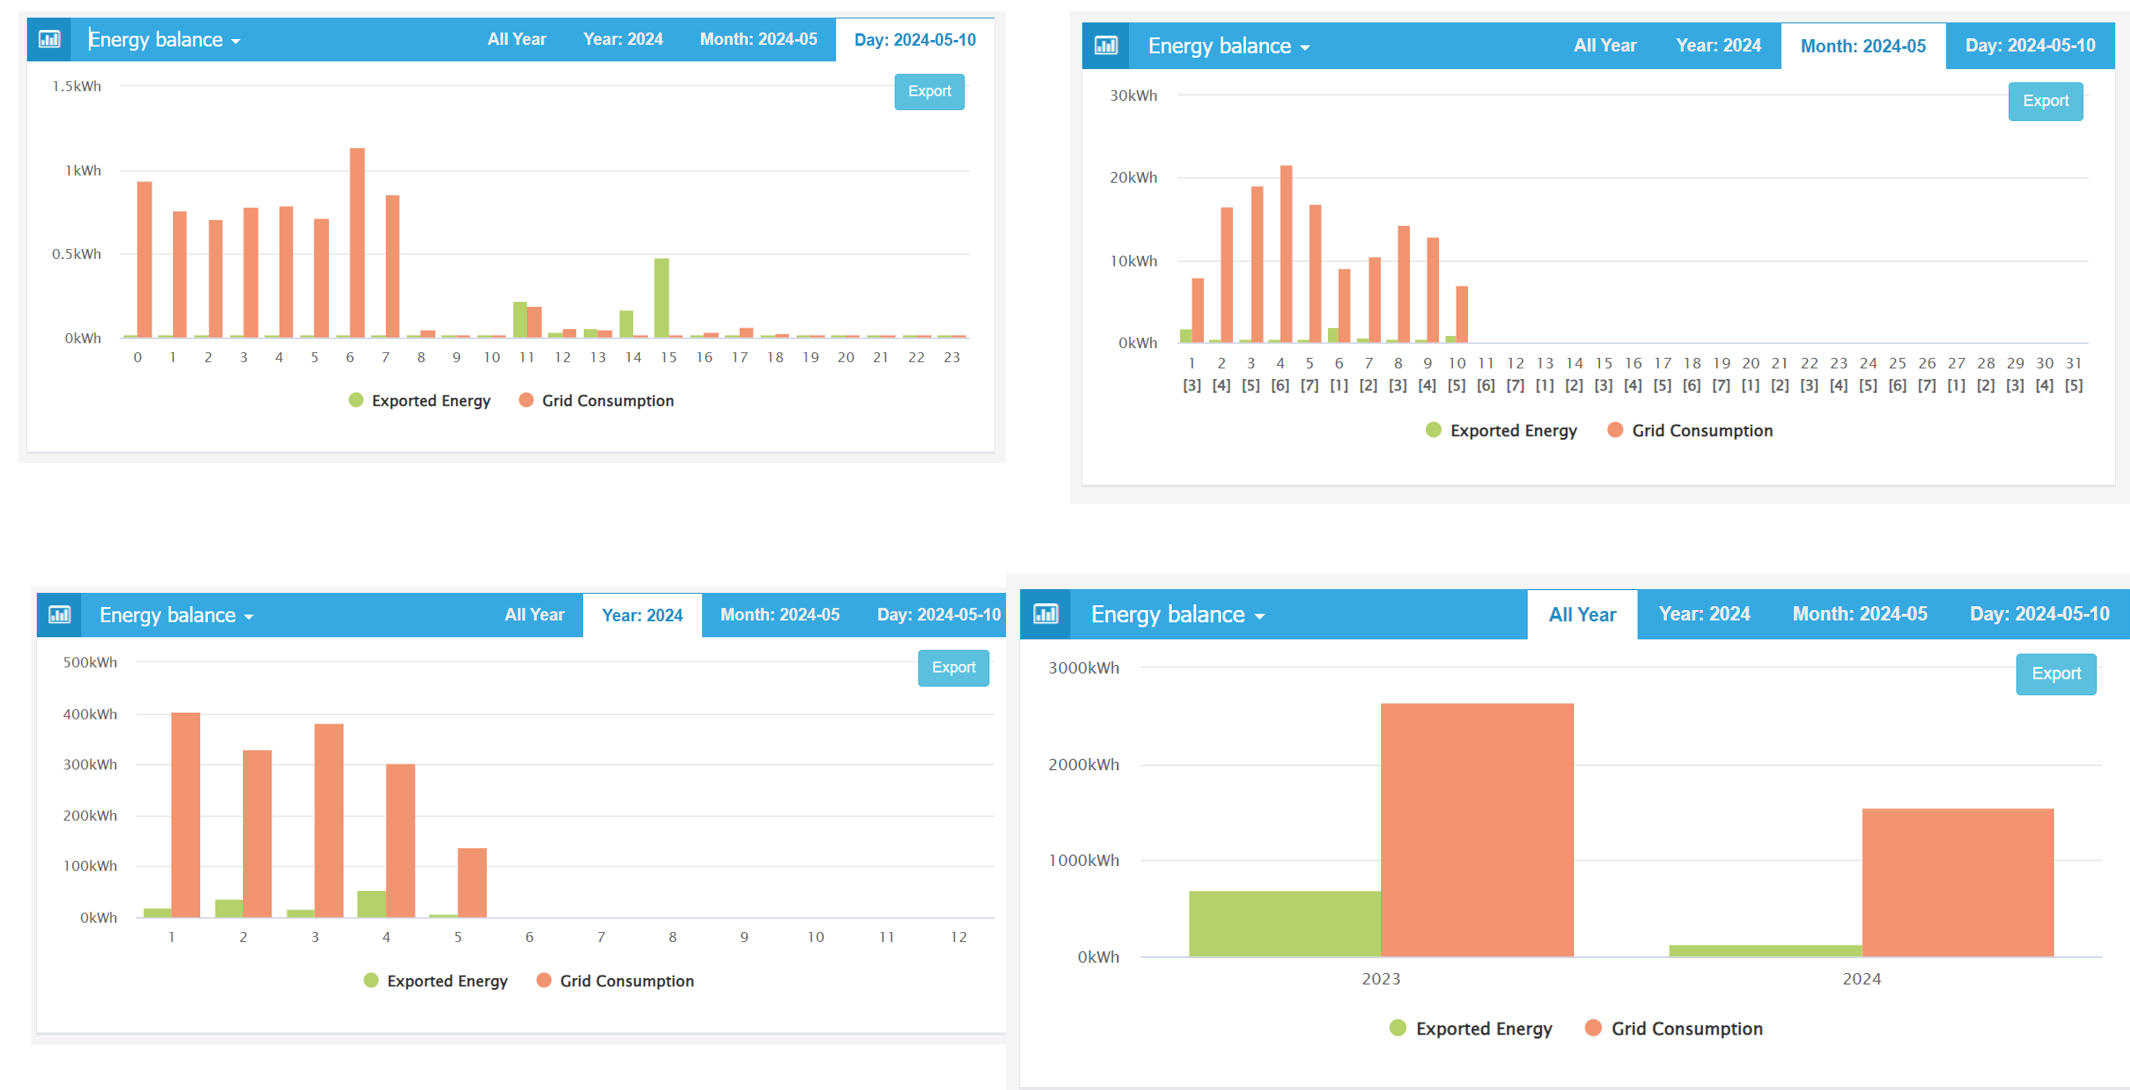
"Grid Consumption" VS "Exported Energy"
"Grid Consumption" and "Exported Energy" are both measured directly by the meter installed at the grid end.
Viewing these two datasets together presents another dimension of the photovoltaic system's operation.
Moreover, if there are some periods where both "Grid Consumption" and "Exported Energy" are high, we should consider taking some optimization measures to use "Exported Energy" to offset "Grid Consumption".
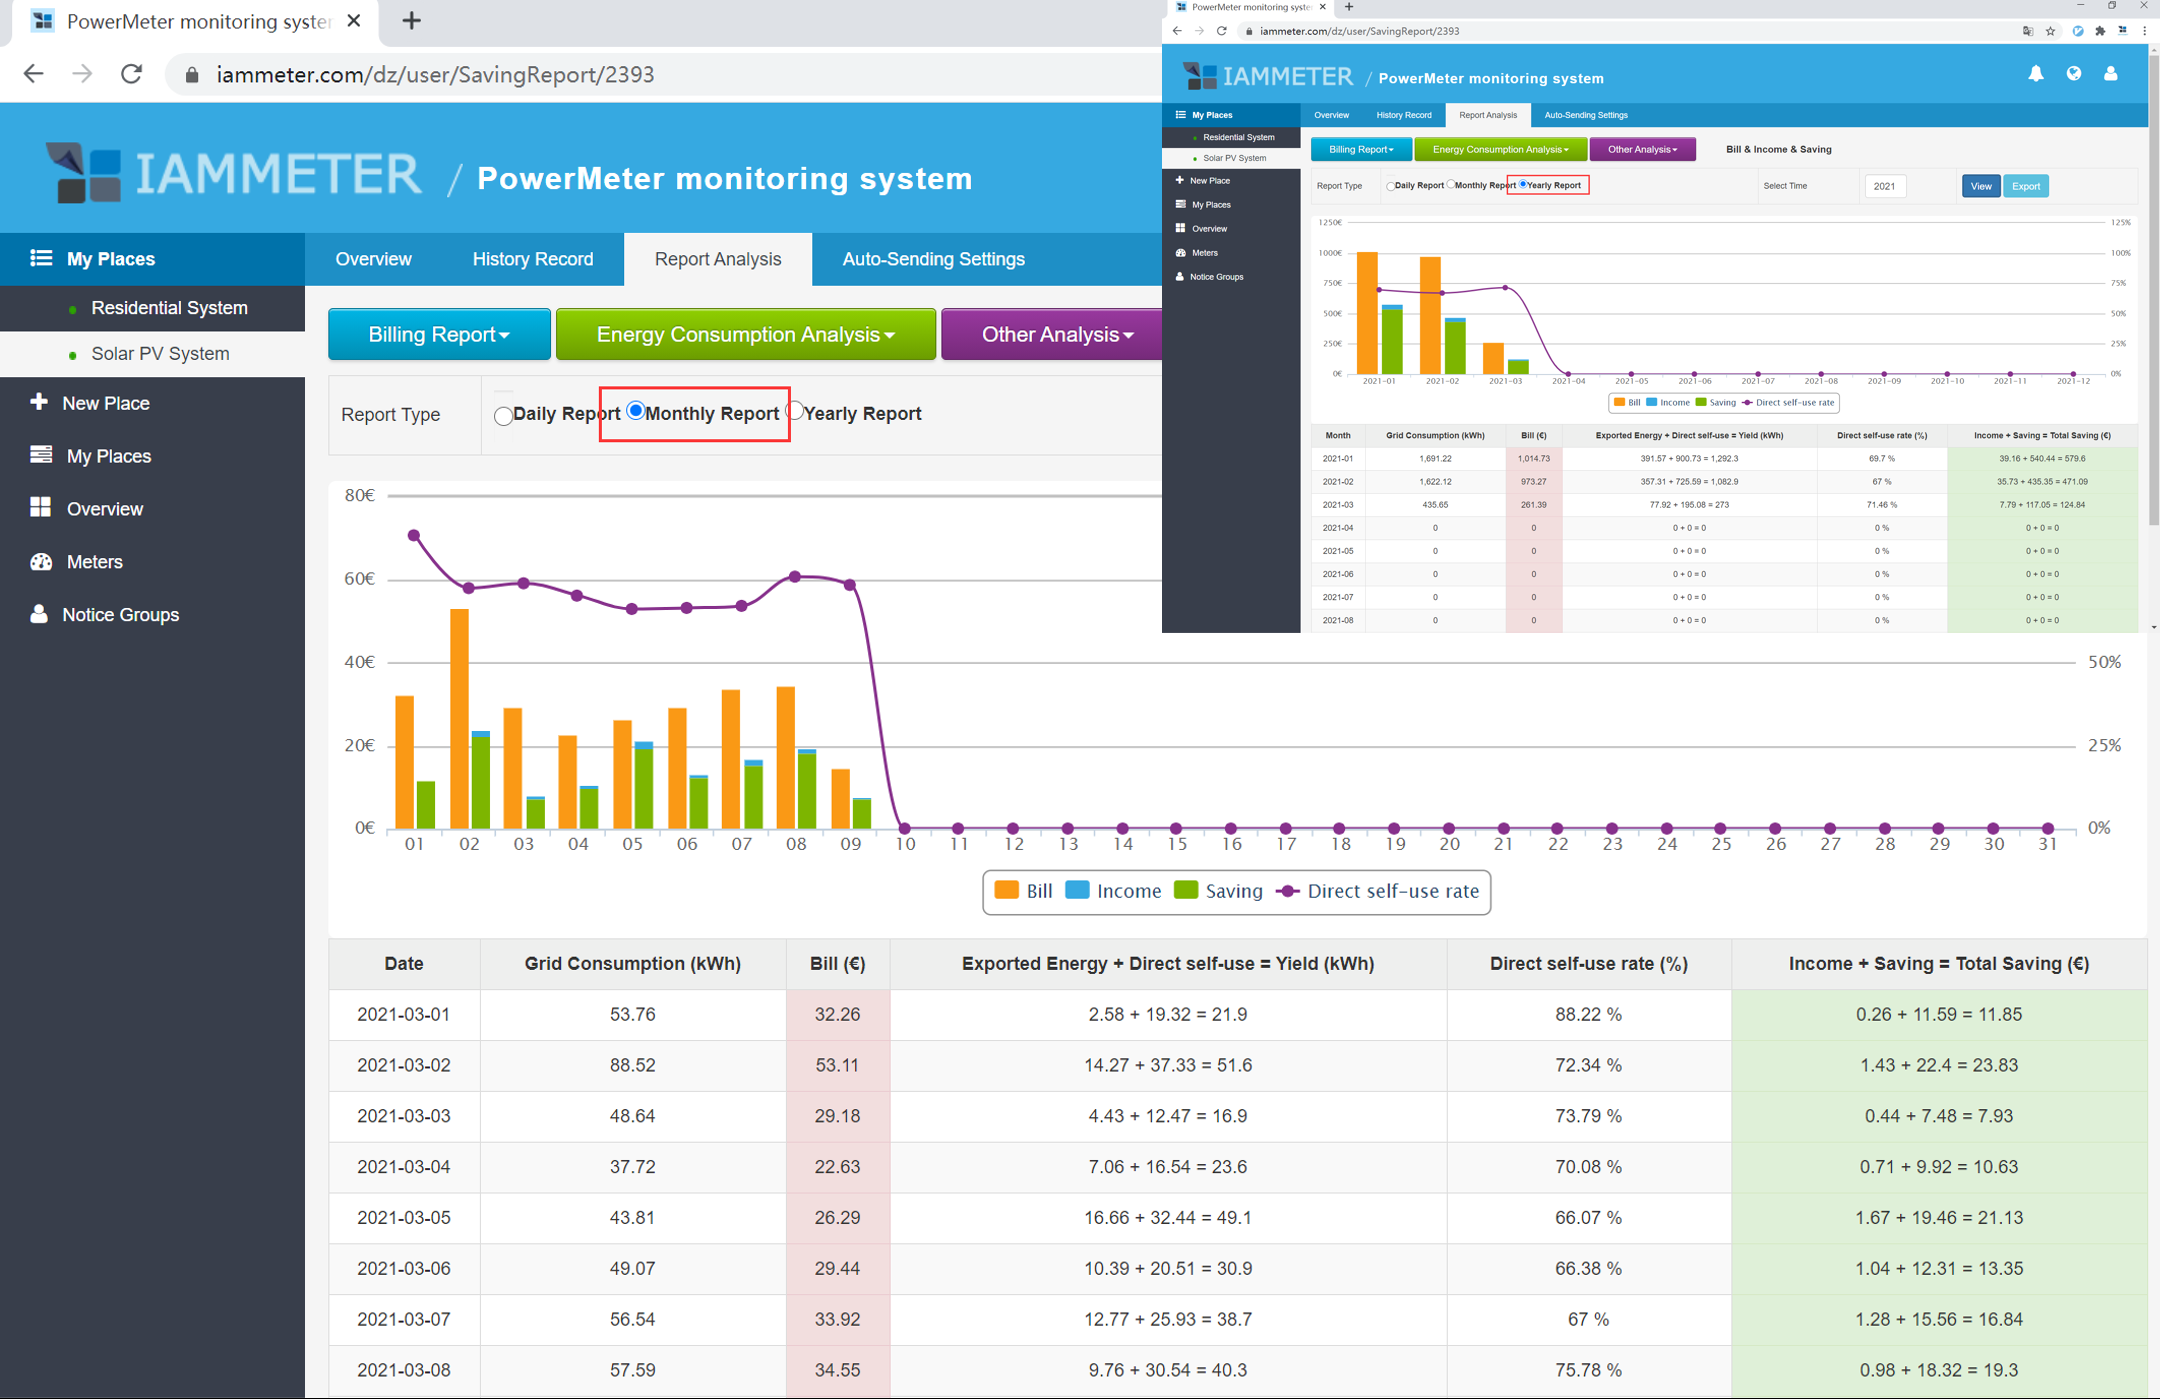
Intuitive Analysis of "Income" and "Saving" Reports
The various charts mentioned above primarily analyze Kwh data.
In addition, IAMMETER provides powerful reports that can directly help users analyze cost data.
With the reports provided by IAMMETER, you can fully grasp hourly, daily, monthly, and yearly data as follows:
"Bill": Electricity costs, equal to "Grid Consumption (Kwh)" multiplied by the electricity price.
"Income": Income from the grid-fed electricity, equal to "Exported Energy (Kwh)" multiplied by the feed-in tariff.
”Saving“: Electricity costs saved by the "Direct self-use (Kwh)" portion, equal to "Direct self-use (Kwh)" multiplied by the electricity price.
"Direct self-use rate (%)": Self-consumption rate, equal to "Direct self-use (Kwh)" divided by "Yield (Kwh)".
For more details on the reports, please click https://www.iammeter.com/docs/solar-report
Supporting Various Complex Electricity Pricing Models
To help customers save money, calculating electricity costs accurately is a necessary condition.
IAMMETER supports multiple electricity pricing templates, including "Fixed Rate," "Tiered Rate," "Time of Use (TOU)," and "Advanced Time of Use."
In the calculation of grid electricity costs, it also supports "Fixed rate," "Tiered Rate," and "Time of Use (TOU)."
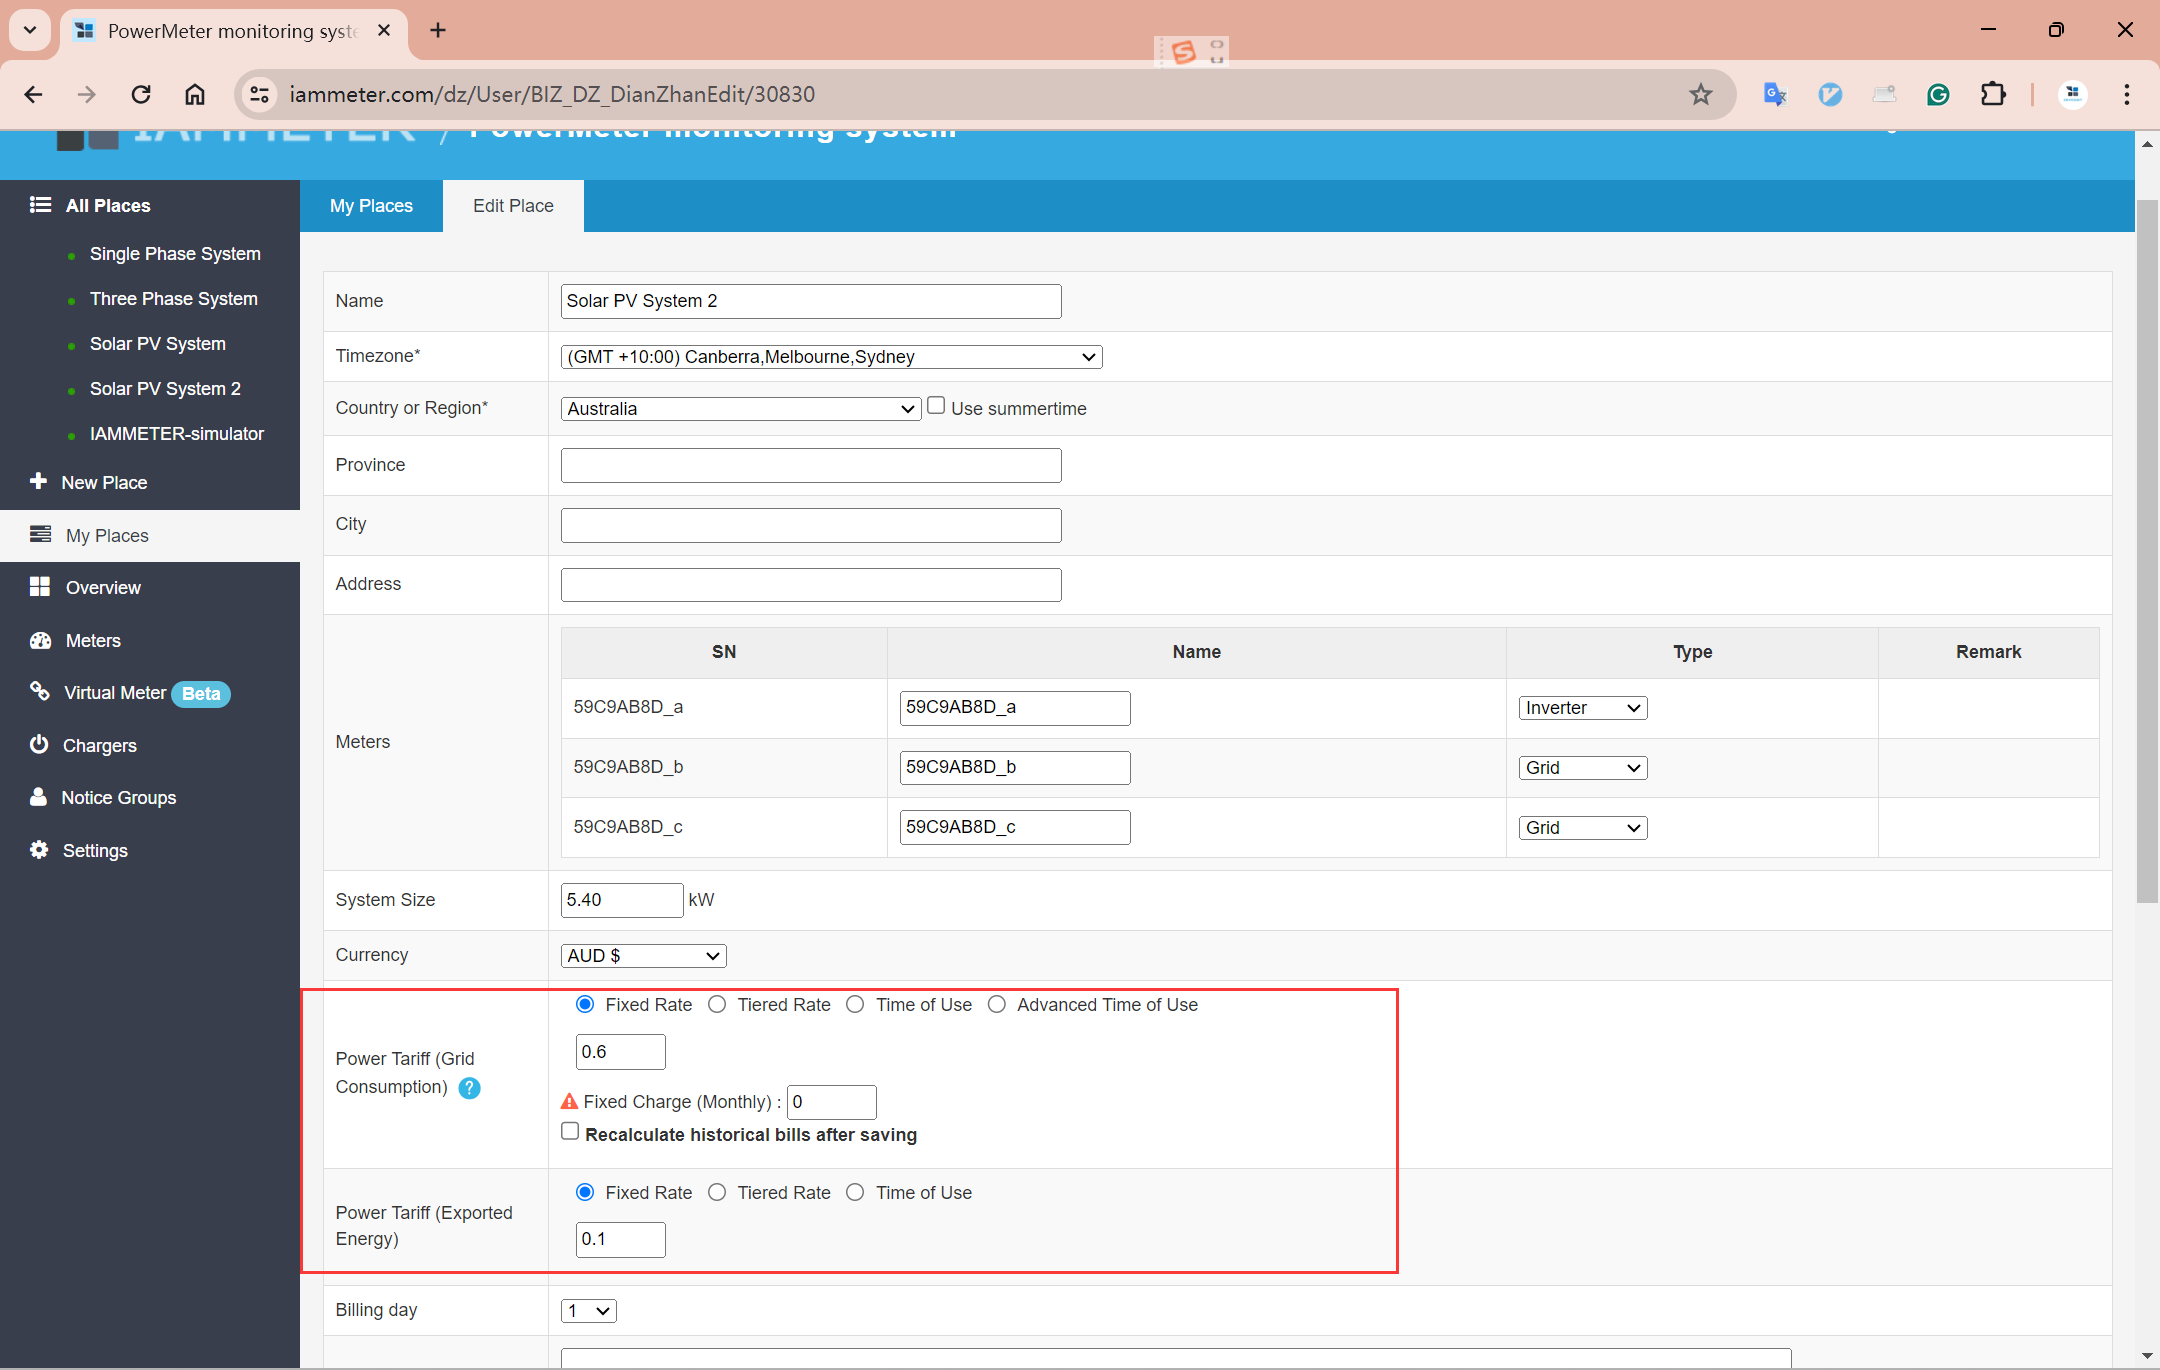
For more information, please refer to https://www.iammeter.com/docs/set-power-tariff
Conclusion
Through this document, we hope you have learned how to use IAMMETER to gain insights into your photovoltaic system. Once you have a firm grasp of your system's parameters, you can manually make some adjustments to try and increase the self-consumption rate. For example, turning on high-power loads during periods of high solar output to see if it enhances the self-consumption rate.
You can also refer to the tutorials below to adjust the output power of heaters, the charging power of electric vehicles, and the status of socket switches, etc., based on the real-time data of GRID power.
Control the EV charger via OCPP, get higher self-use rate in solar pv system
Control other devices with regard to the value of power reading
For more details ,please refer to Part 2: Optimizing Your Photovoltaic System
IAMMETER`s products
Which type of electrical meter best fits your needs?
| model | |
|---|---|
| Single Phase | WEM3080 |
| Single-Split (Dual or 2 Phase) and 3 Phase(Wye connection) | WEM3080T,WEM3046T,WEM3050T |
| 3 Phase(Delta connection) | WEM3080TD |


")
")