


New report: Special load source analysis
New report: Special load source analysis
Report Introduction
"Place"->"Report Analysis"->"load analysis"->"Special Load Source Analysis"
From this report, you will understand the power supply percentage of the "special load".
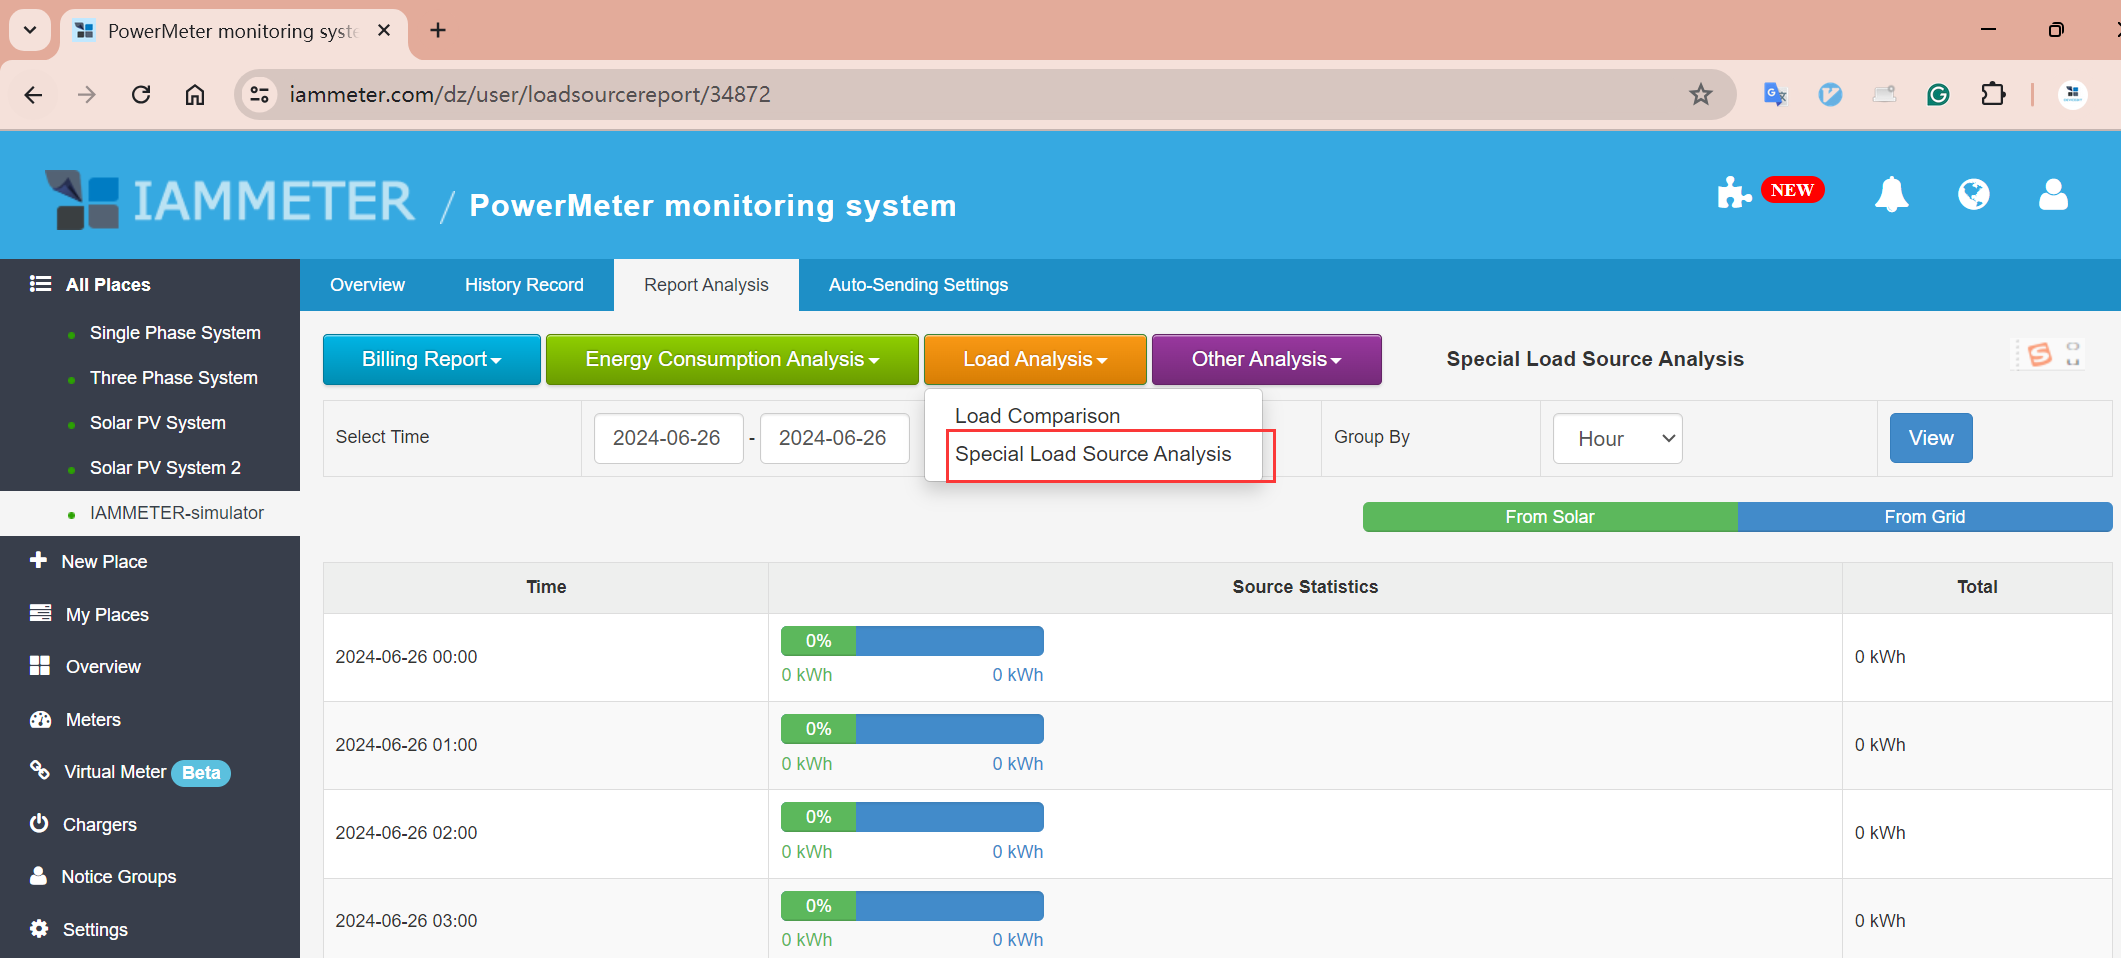
You can analyze the data hourly, daily, and monthly, with data retention up to two months.

Analyzing Report Results with Real Data
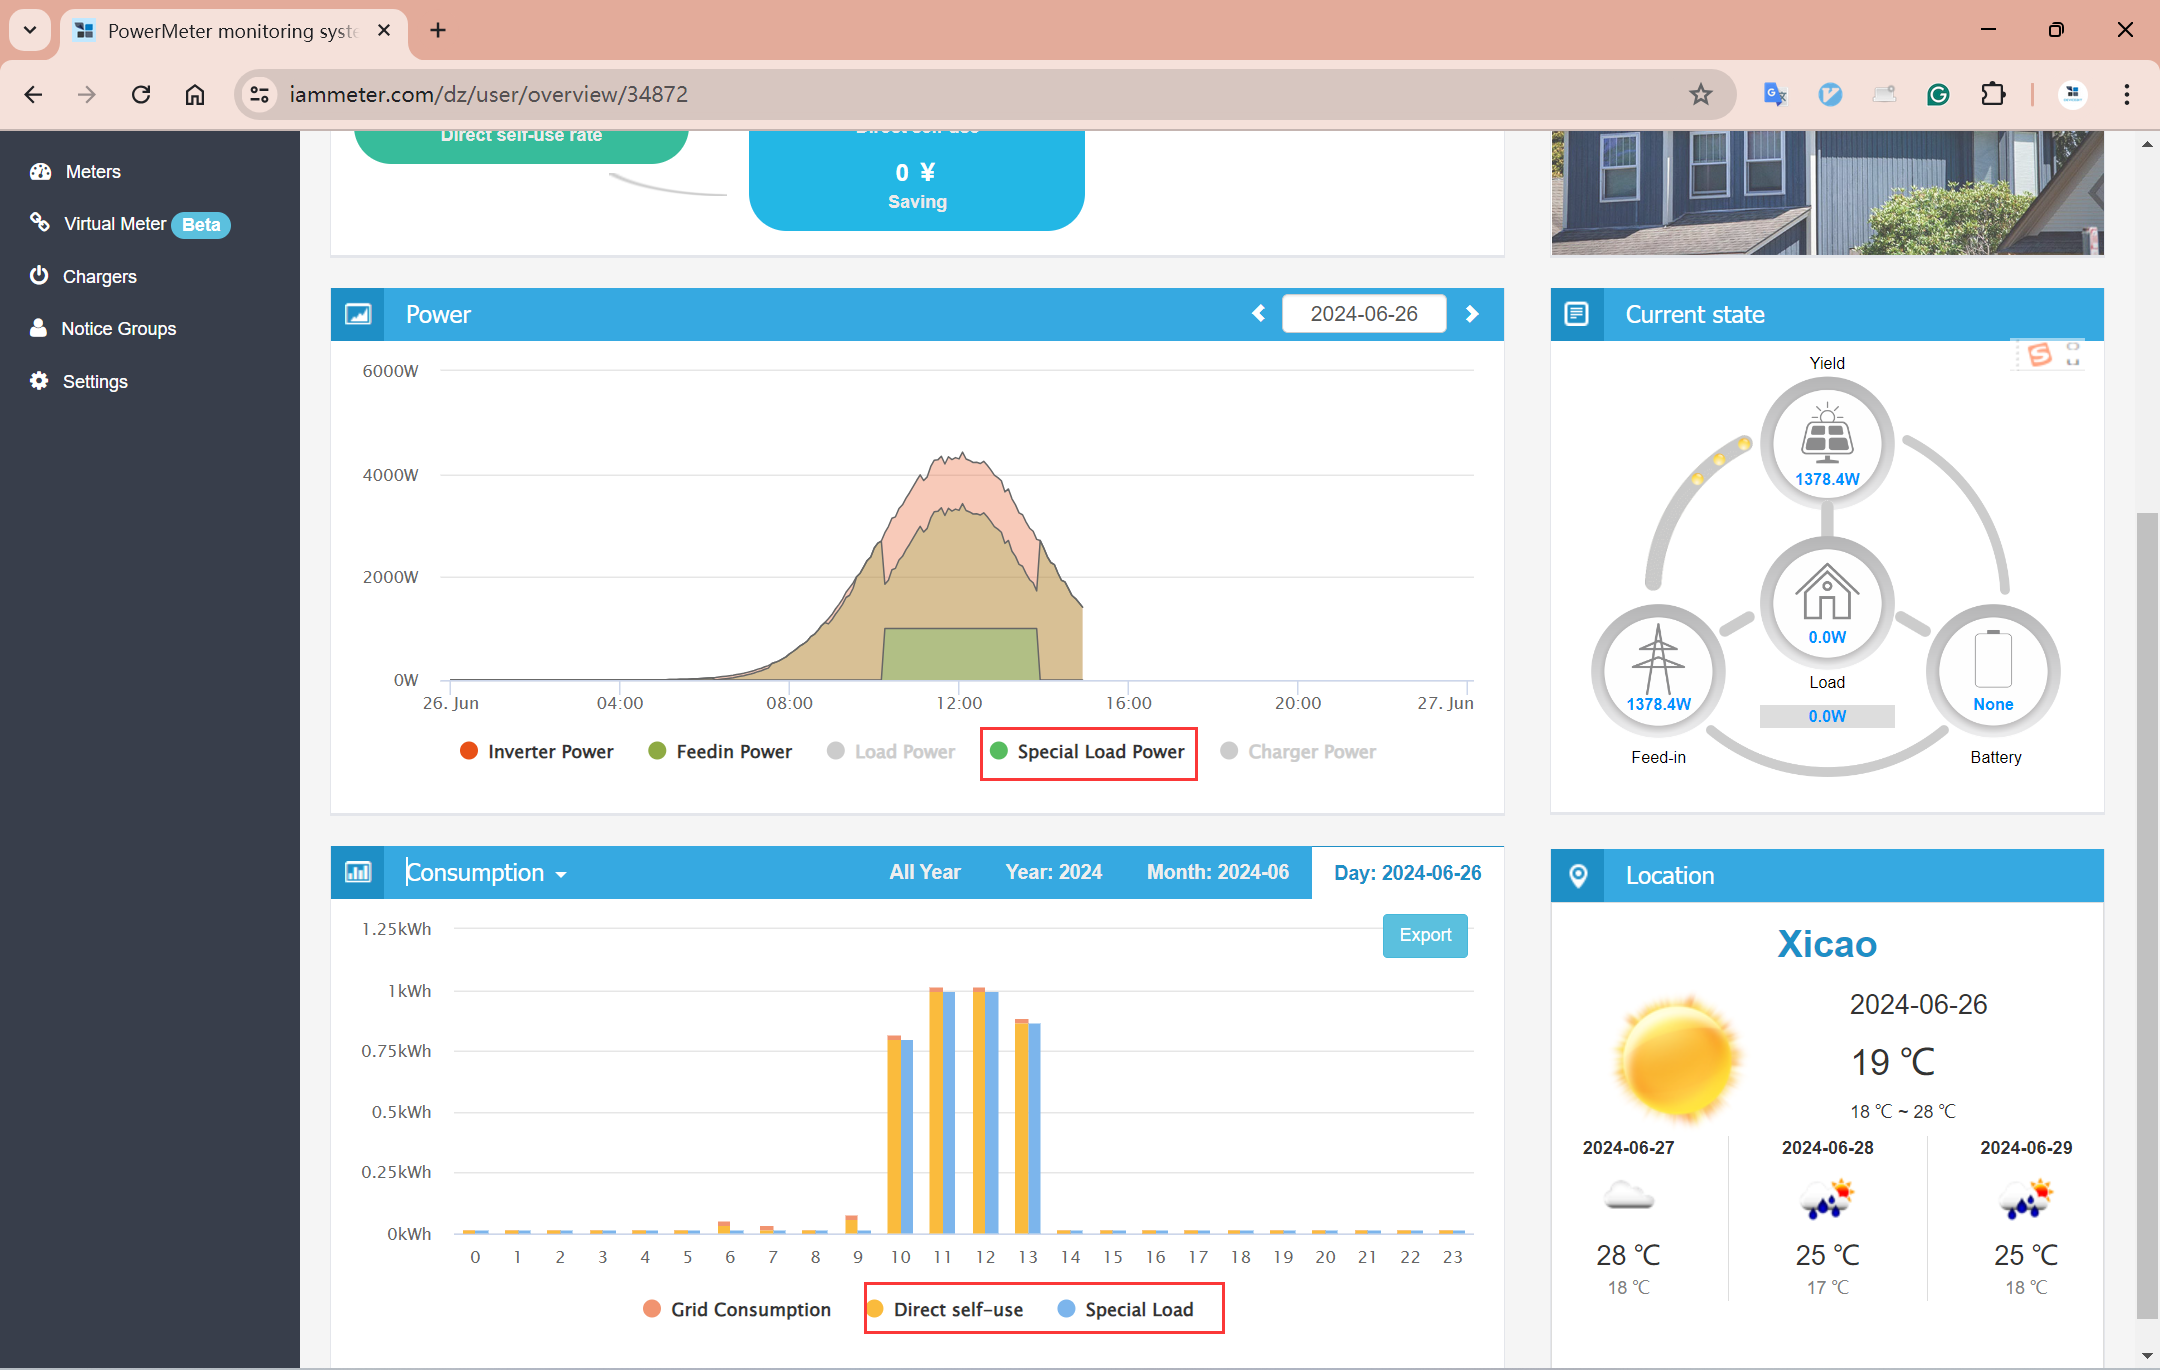
This is data from a simulated "place" using the IAMMETER-Simulator. There is a fixed "special load" between 10 AM and 1 PM every day.
From the power chart on the "overview" page, you can see the power curves .
From the "Consumption" bar chart, you can see:
- The "special load" appears between 10 AM and 1 PM, accounting for nearly all the "load" consumption.
- During the same period, photovoltaic generation completely covers the "load" consumption.
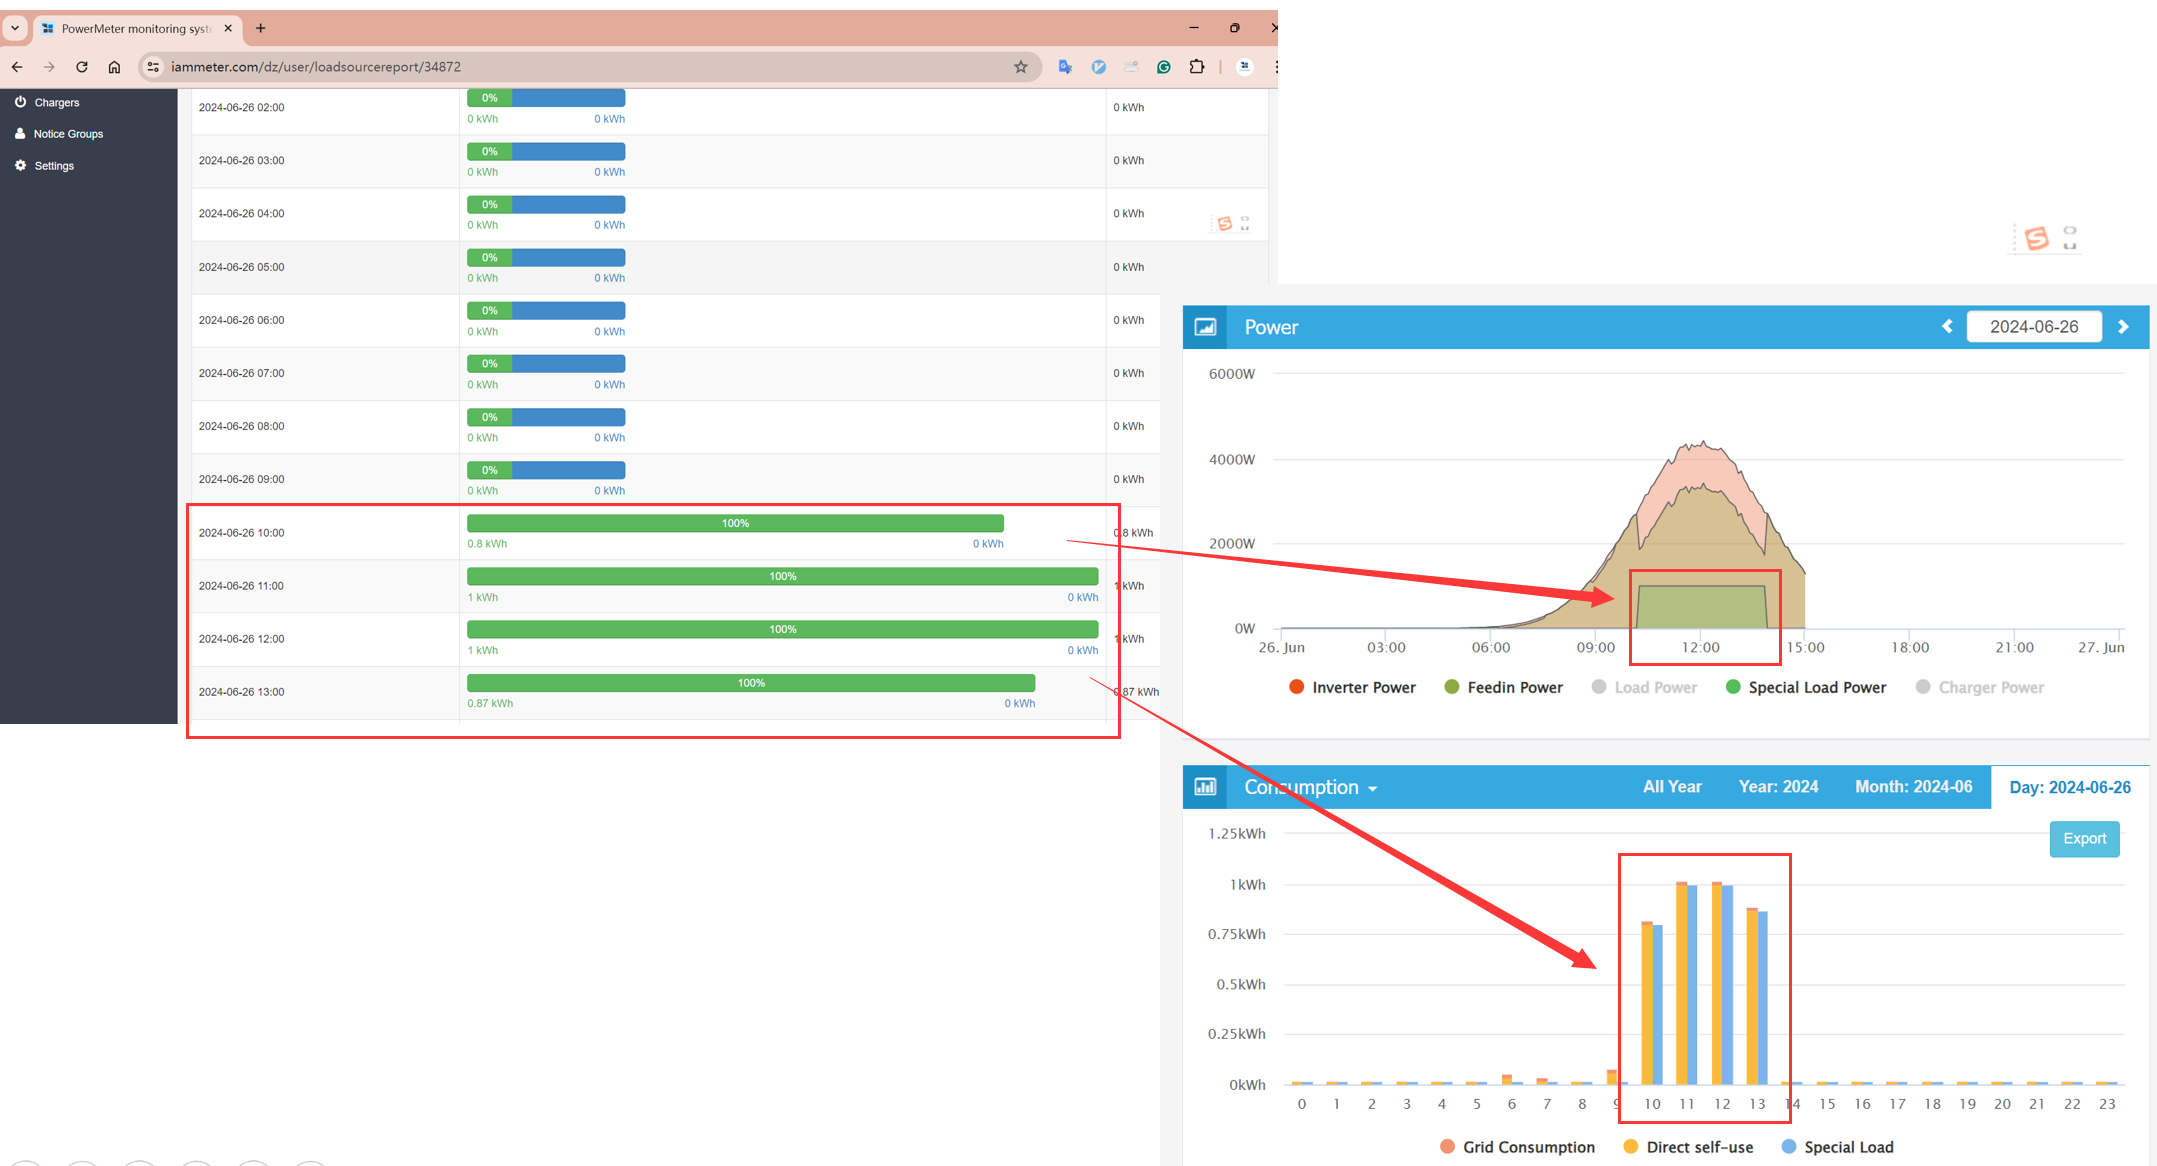
The "Special Load source analysis" report also shows the same conclusion. Between 10 AM and 1 PM, the "special load consumption" is entirely supplied by the "From solar" section.
How This Report Is Calculated
Finally, let's discuss how this report is calculated.
Unlike the hourly data on the Overview page, this "Special Load source analysis" actually uses minute-by-minute data to get the analysis results. Therefore, the data volume is quite large, which is why we limit the analysis to two months of data.
Every minute, the kWh consumption of the "special load" is read. If it is not zero, the grid consumption in kWh for that minute is also read, and the min(grid kWh, special load kWh) is taken as the special load's grid power consumption for that minute.
For example, for a given minute:
- If special load kWh = 0.02 kWh and grid consumption kWh = 0.01 kWh, it is considered that 0.01 kWh of the special load is provided by grid power for that minute.
- If special load kWh = 0.02 kWh and grid consumption kWh = 0.05 kWh, it is considered that 0.02 kWh of the special load is provided by grid power for that minute.
As this algorithm shows, we use the most "pessimistic" estimation mode to estimate the energy consumption ratio of the "special load", assuming that photovoltaic power is prioritized for other loads, and the remaining part is given to the "special load".
Of course, this is also the working logic of our newly launched Linear Power Controller-SCR-485. It uses solar surplus to heat the water heater.
Why This Report Exists
IAMMETER has always been committed to helping PV users achieve greater benefits through system optimization, as described in Part 2: Optimizing Your Photovoltaic System.
The key is to maximize self-consumption of the electricity generated by your system. Since revenue from feeding electricity into the grid is low, we aim to minimize grid feeding and maximize direct consumption of solar power.
Therefore, we launched the SCR-485: a smart Thermostat “Helper” with Linear Power Adjustment, “Wi-Fi Voltage Controller”.
The SCR-485 can help customers fully utilize solar surplus to heat water tanks, thereby utilizing as much solar feed-in electricity as possible while reducing grid power usage.
This is a test report from a customer on the SCR-485: The First Customer Feedback-Based Test Report on SCR-485.
Other Similar Reports
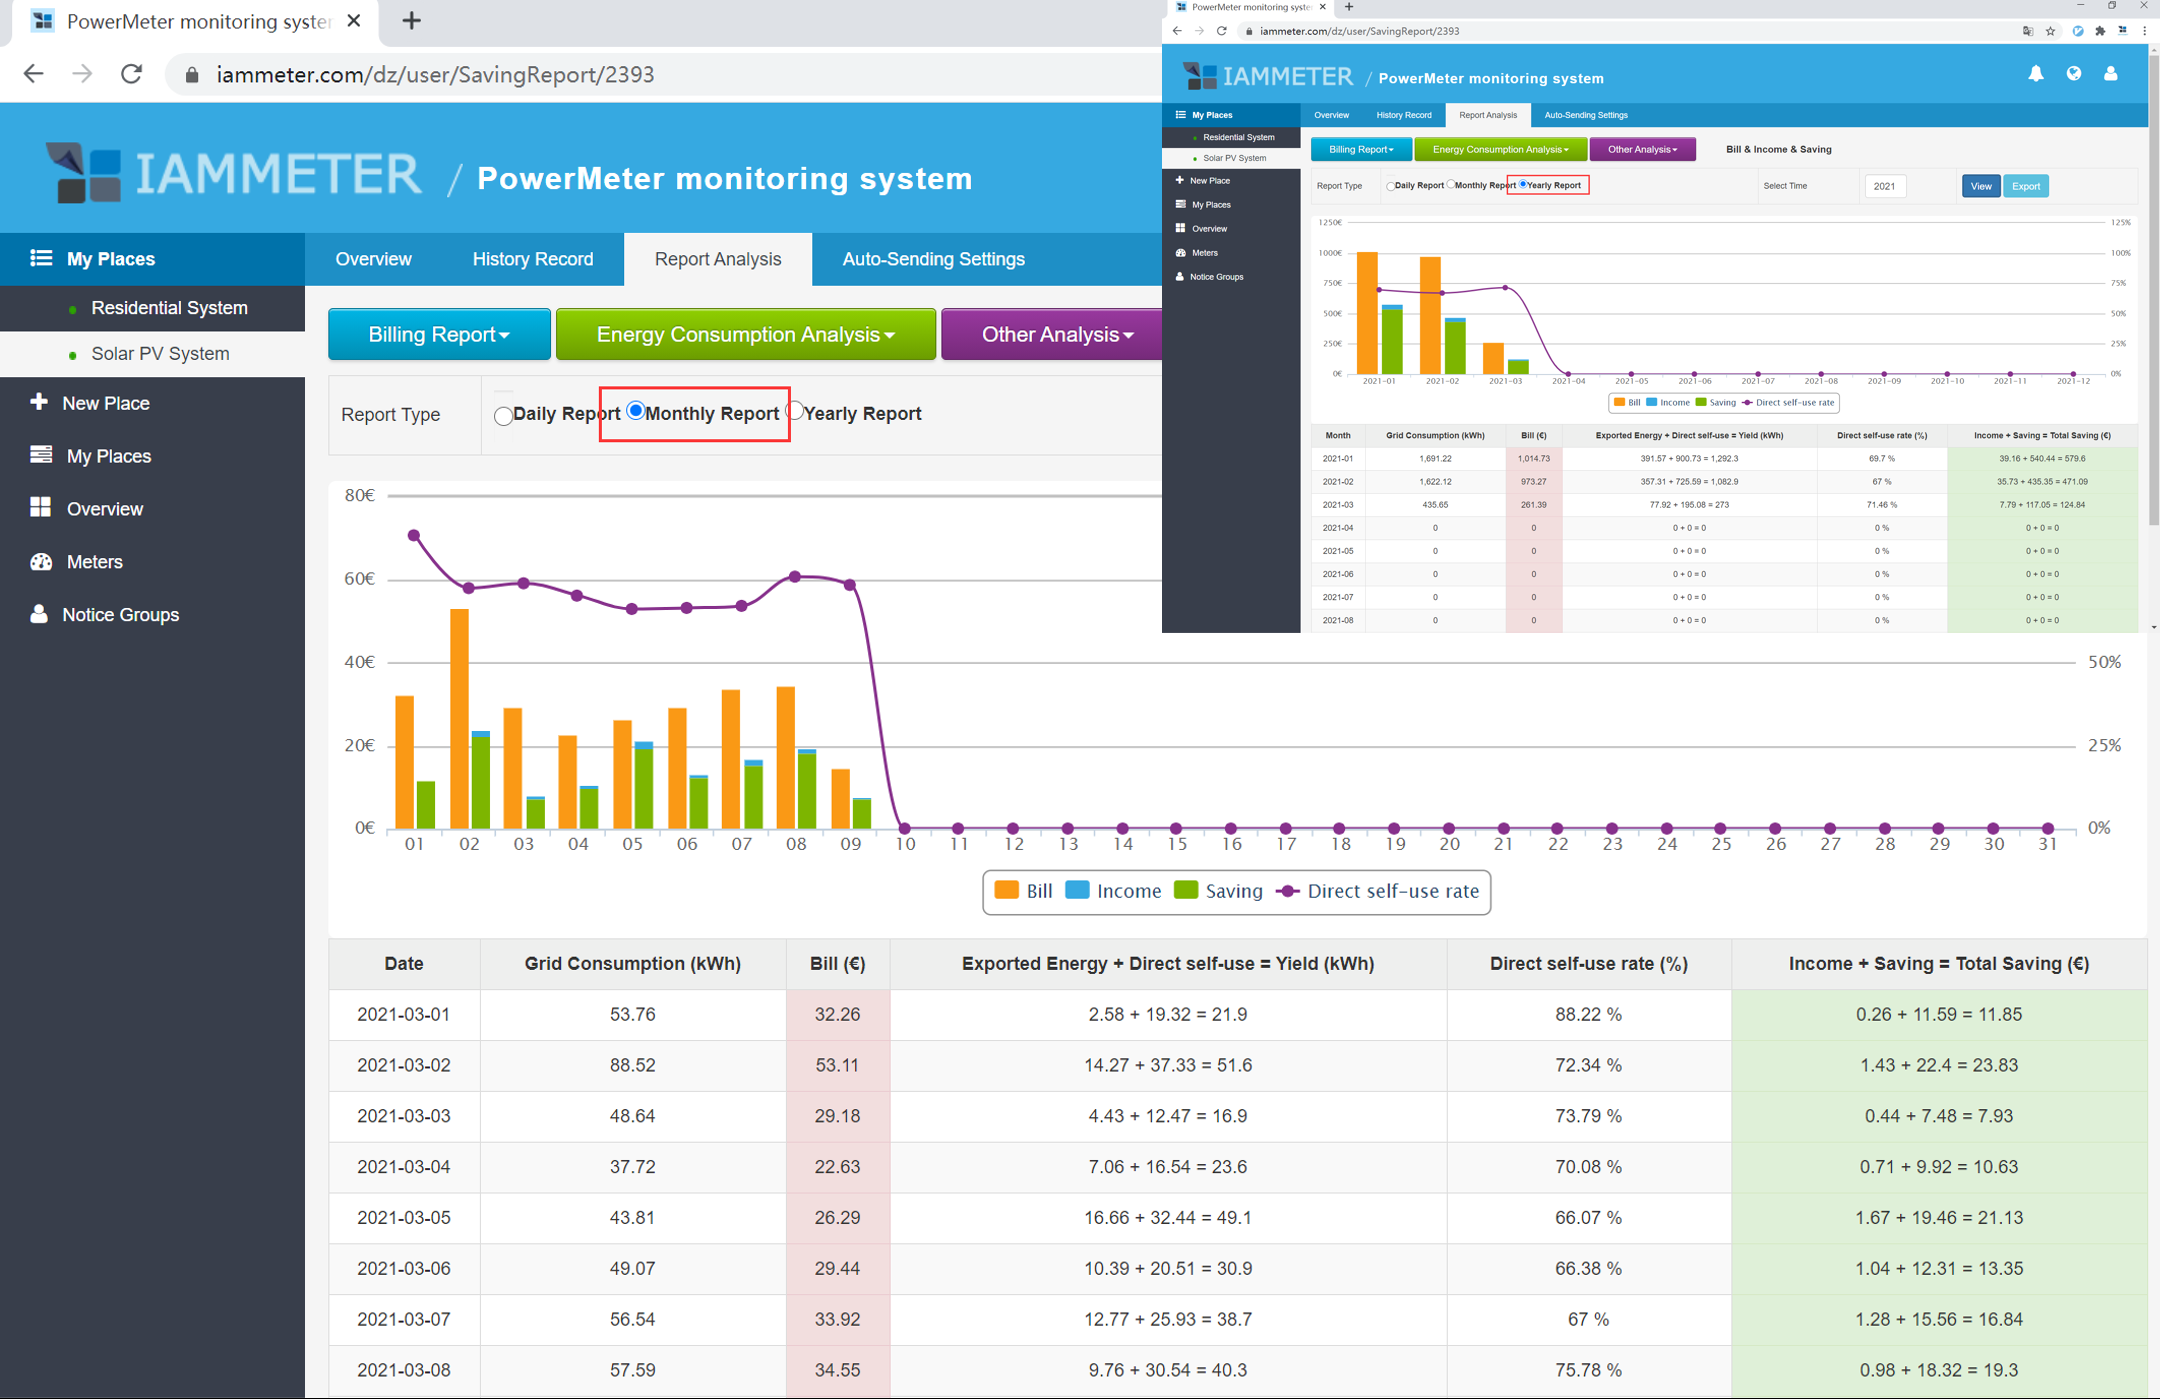
This report shows Direct Self-use Rate and Total Saving (Money saved by consuming direct self-use energy instead of grid energy + income of exported energy to grid) of your solar PV system.


")
")